Example 13: Estimation of maximum and minimum developed stresses on a built-up steel section under given external loads
Watch the video of this example >
Data for Cross Section Analysis & Design application
In this example we will calculate the stresses developed in the cross section discussed in Example 11 and create corresponding stress contours.
The partial safety factor for steel is assumed to be 1.0.
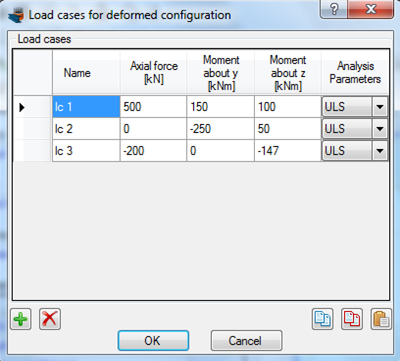
Load cases
| lc 1: | N = 500 kN | My = 150 kNm | Mz = 100 kNm |
| lc 2: | N = 0 | My = -250 kNm | Mz = 50 kNm |
| lc 3: | N = -200 kN | My = 0 | Mz = -147 kNm |
Solution with Cross Section Analysis & Design
Opening a file from disk
First of all we click on the File menu and select Open in order to open the file we created in Example 11.
Unlock the model
Afterwards, if the model is locked, we click on Edit -> Unlock model, in order to modify the geometry of the cross section.
In the popup window, we choose Yes to unlock the model.

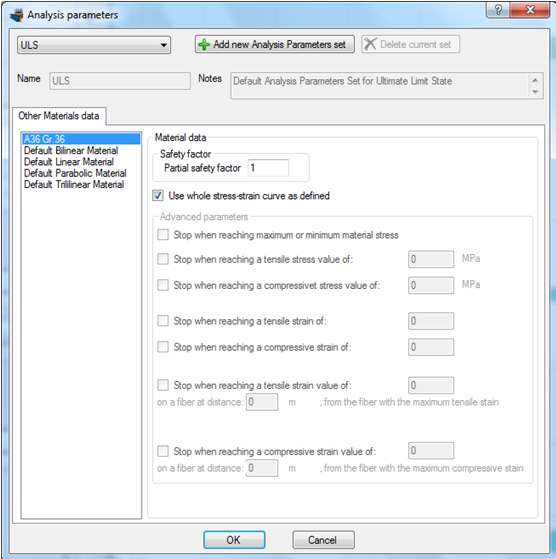
Review of Analysis Parameters
The partial safety factor of the steel A36 Gr.36 is set to 1, so we do not need to change anything in the form below. We click OK to close the form.
Definition of load cases
First we will define the load cases by clicking on the Analysis -> Deformed configuration -> Load cases menu item.
The load cases can be defined by successively clicking on the  button. We have to make sure that the “ULS” Analysis Parameters set have been assigned to each load case.
Carry out the analysis
We just click Analysis -> Deformed configuration -> Analyze, to perform the analysis.
Results
The requested interaction diagrams can be obtained by clicking click Analysis -> Interaction (advanced) -> Show results.
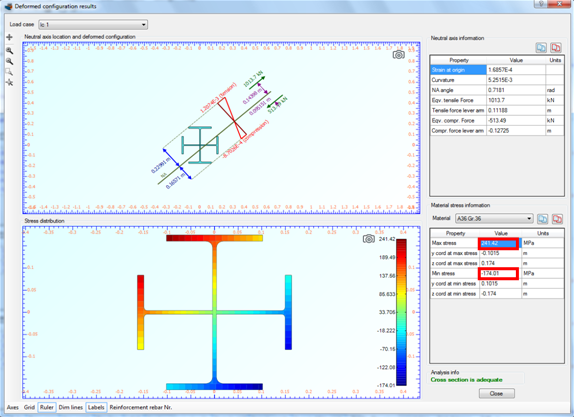
Results for load case lc1:
We choose “lc1” from the list at the top right corner of the form. The corresponding strain distribution and stress contour are shown. Moreover, information about the maximum/minimum stresses developed on the section can be found on the right.
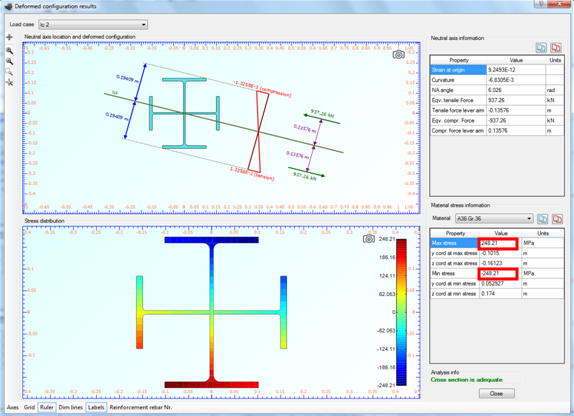
Results for load case lc2:
Respectively, by selecting “lc2”, appears the corresponding information for the second load case.
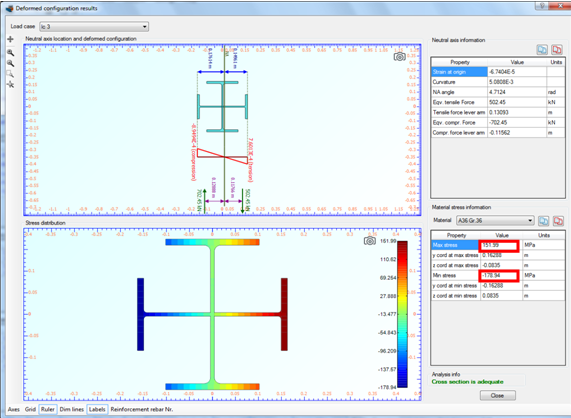
Results for load case lc3:
Respectively, by selecting “lc3”, appears the corresponding information for the second load case.
As we can see, the maximum stress is developed for load case “lc2” and has a value of 248.21 MPa. The minimum stress is -248.21 MPa for “lc2” as well.
Since this stress is equal to the yield of A36 Gr.36, we can conclude that some parts of the cross section have entered the plastic region.
Watch the video of this example