Example 3: Moment vs. Curvature Curve for specific axial force levels
Watch the video of this example >
Data for Cross Section Analysis & Design application
The creation of Moments vs. Curvature curves using Cross Section Analysis & Design will be demonstrated in this example. The used cross section is similar to that defined in Example 2.
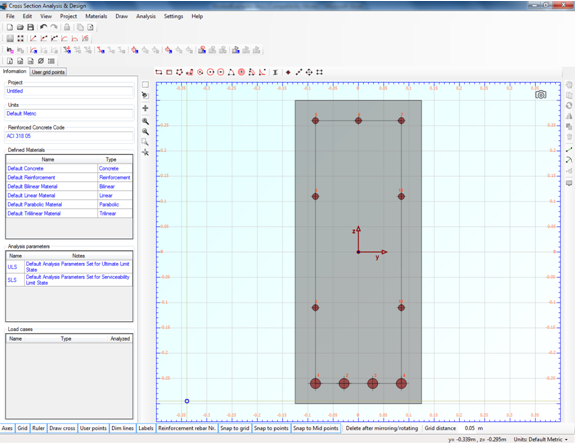
Geometry of cross section
Moment vs. Curvature diagrams data
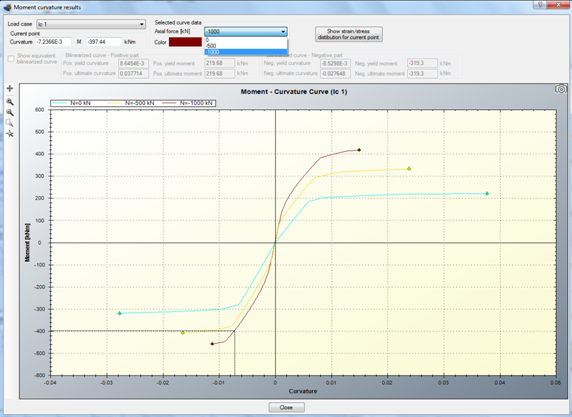
The Moment vs. Curvature diagram for bending about Y axis is requested for the following axial force values:
- N = -1000 kN (compressive)
- N = -500 kN (compressive)
- N = 0 (no axial force)
Solution with Cross Section Analysis & Design
Opening a file from disk
First of all we click on the File menu and select Open in order to open the file we created in Example 2.
Unlock the model
Afterwards, if the model is locked, we click on Edit -> Unlock model, in order to modify the geometry of the cross section.
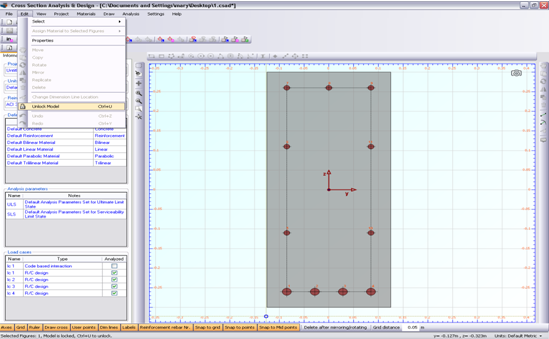
In the popup window, we choose Yes to unlock the model.

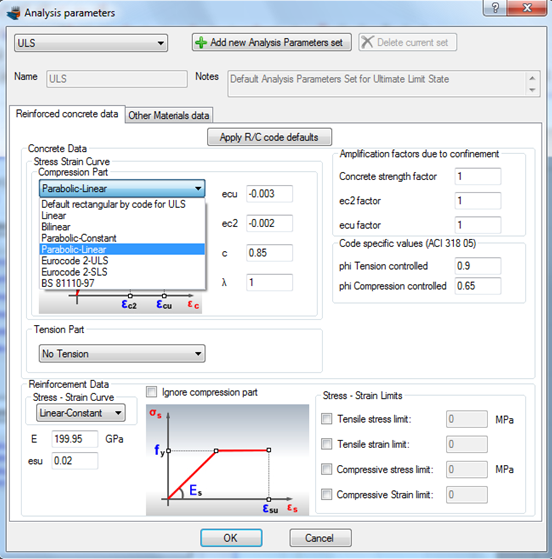
Review Analysis Parameters
We click on Analysis -> Analysis Parameters menu item to view the existing Analysis Parameters sets. In the “ULS” set, the concrete stress distribution is chosen to be rectangular, which only applies to ultimate limit states and it has to be changed since the Moment vs. Curvature curve will be created for all possible stress states of the section, from the unstressed one to its failure.
Thus, we choose a Parabolic-Linear stress strain - curve for concrete compressive parts. All remaining values (factors, strains etc.) are now set according to ACI 318 regulation. By clicking OK the form is closed.
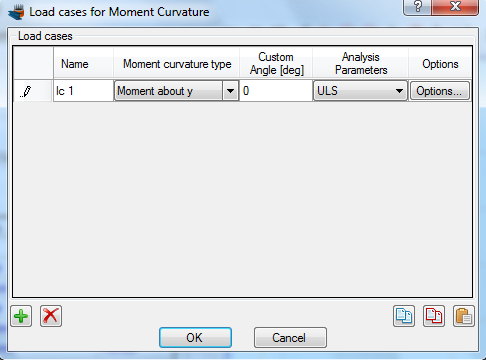
Definition of load cases
The load cases for Moment vs. Curvature analysis can be selected by clicking on the Analysis -> Moment Curvature -> Load cases menu item. By clicking the  button we can add a new load case. The Moment curvature type is set to “Moment about y”, the Custom Angle (coordinate system rotation) is left to 0 and the Analysis Parameters item is changed to “ULS” so that we can use the parameters defined previously.
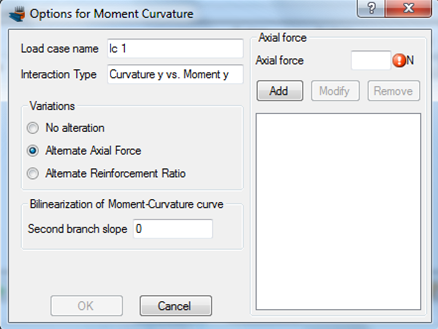
In order to use specific axial forces for the analysis, we click on “Options” button and in the form that shows, we select the option “Alternate Axial Force”.
Next we enter the axial force values successively in the corresponding field at the top right corner of the form and click the “Add” button, so that all axial forces have been filled, as shown below.
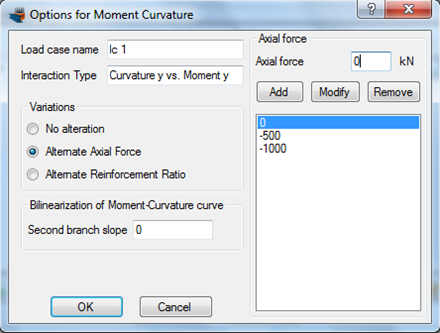
We can also define the slope of the second branch of the equivalent bilinearized curve here, but we keep this value equal to 0. This means that the calculated bilinearized curve will be elastic-fully plastic. We click OK to close the form.
Carry out the analysis
We just click Analysis -> Moment Curvature -> Analyze, to perform the Moment Curvature analysis.
Results
The results can be obtained from the Analysis -> Moment Curvature -> Show results menu item.
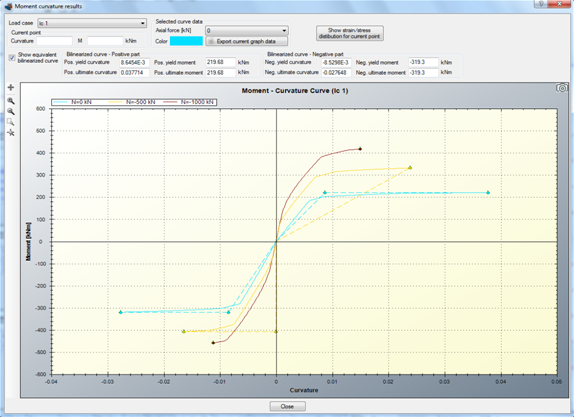
The Moments vs. Curvature diagrams for the three specified axial force levels are shown in the form. We note that the equivalent bilinearized curves (same color, but dashed) have also been calculated. These can disappear by unchecking the “Show equivalent bilinearized curve”.
The color of each curve can be controlled from the corresponding “Color” box after selecting the curve to modify by its axial force level.
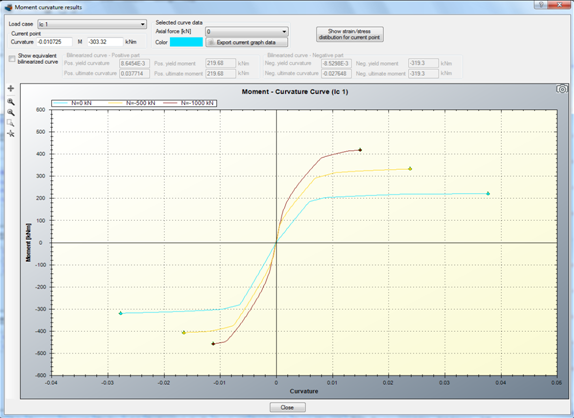
Section stress distribution for a specified point on Moments vs. Curvature curve
Assuming we would like to display the strain distribution and stress contour for a specific point on the diagram for the curve which refers to axial force level of -1000 kN.
First of all we select this value from the related list as shown in the picture below.
Afterwards we move the mouse over the the graph.
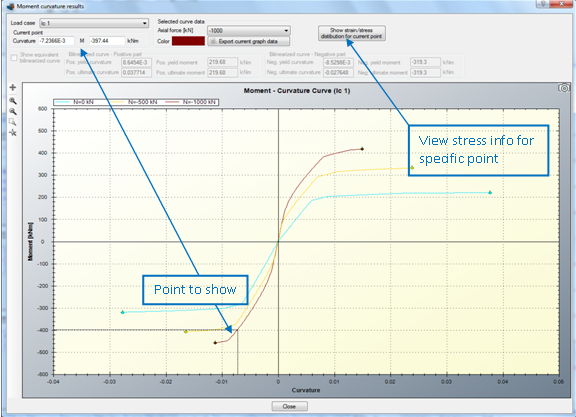
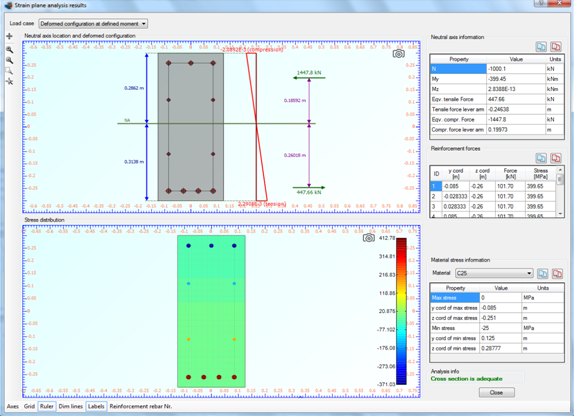
By clicking on “Show strain/stress distribution for current point”, a form is shown, which represents the following data:
- Neutral axis location
- Strain distribution
- Equivalent force couple
- Stress contour on the cross section area
- Reinforcement forces
- Stress information per material
The form is shown below.
Watch the video of this example