Example 10: Construction of interaction diagram for a composite cross section of a column
Watch the video of this example >
Data for Cross Section Analysis & Design application
We will use the file created in Example 9 and construct the interaction diagram according to Eurocode 2.
All design data are to be taken from Example 9.
Interaction diagram data
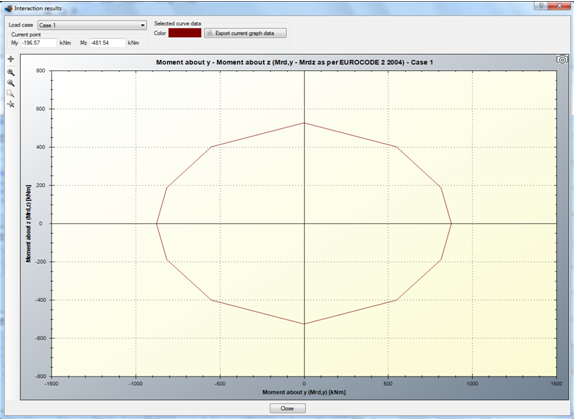
| Case 1: | Moment about Y axis vs. Moment about Z axis for zero axial force |
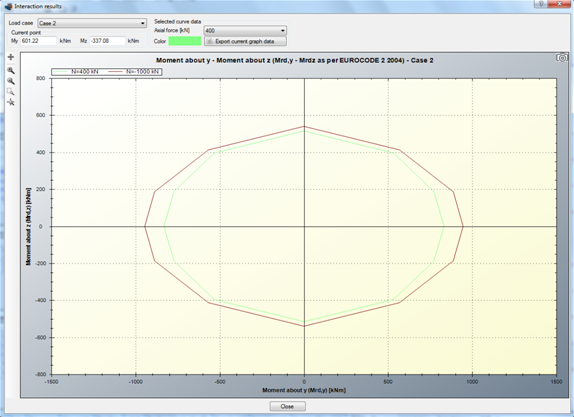
| Case 2: | Moment about Y axis vs. Moment about Z axis for axial force values -1000 kN (compression) and 400 kN (tension) |
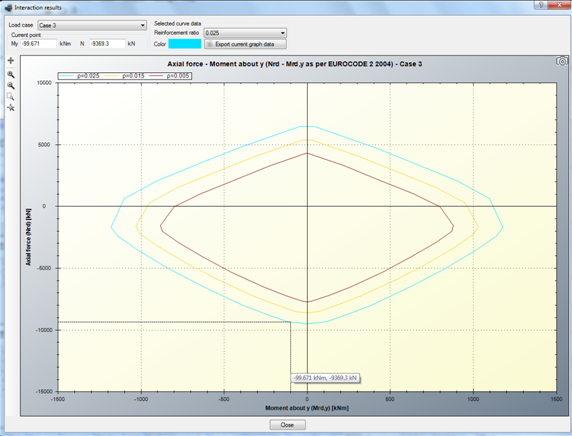
| Case 3: | Moment about Y axis vs. Axial force for reinforcement ratio values: 0.5%, 1.5% and 2.5% |
Solution with Cross Section Analysis & Design
Opening a file from disk
First of all we click on the File menu and select Open in order to open the file we created in Example 9.
Unlock the model
Afterwards, if the model is locked, we click on Edit -> Unlock model, in order to modify the geometry of the cross section.
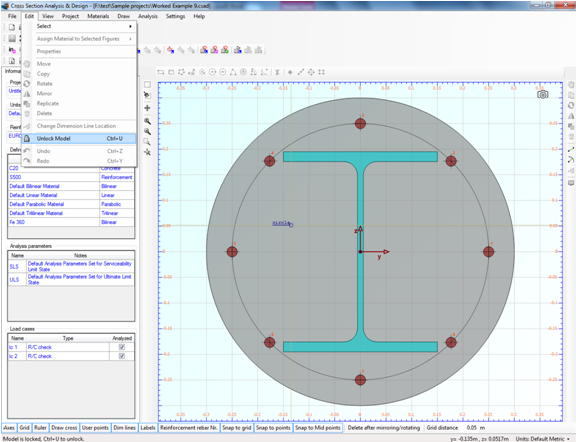
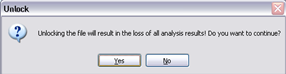
In the popup window, we choose Yes to unlock the model.
Review of Analysis Parameters
We do not need to modify the previously created Analysis Parameters set “ULS”. We can view the assigned properties by clicking Analysis -> Analysis Parameters and selecting “ULS” from the list at the top left corner.
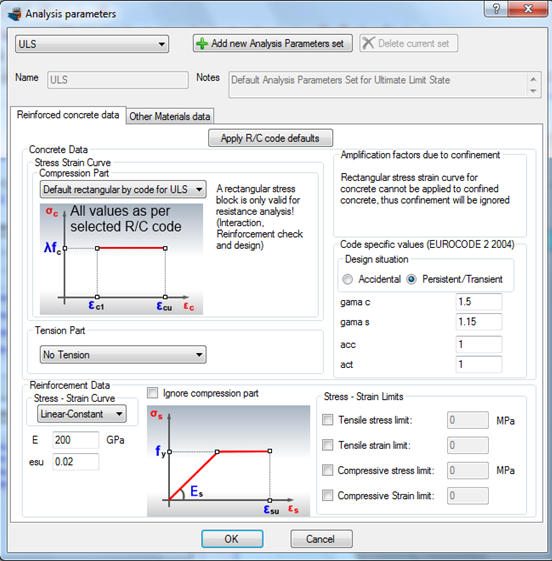
We click OK, as we do not need to change anything.
Definition of load cases
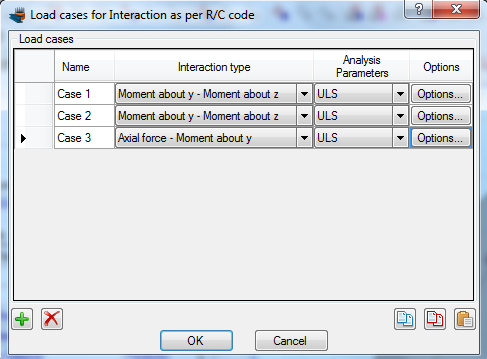
The load cases can be selected by clicking on the Analysis -> Interaction (as per selected R/C code) -> Load cases menu item.
Case 1
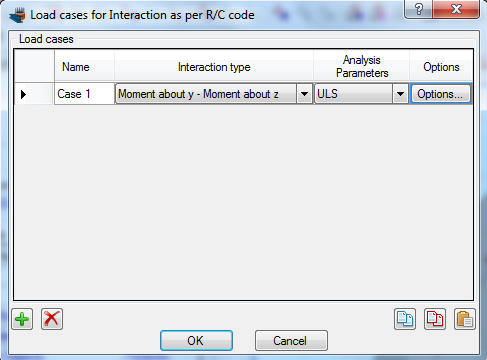
We click on the  button to add a new load case. We change the name to “Case 1” and select “Moment about y – Moment about z” option. The assigned Analysis Parameters set should be “ULS”.
Case 2
We click on the button to add the next load case and change the name to “Case 2”. We make sure that the option “Moment about y – Moment about z” is selected and the Analysis Parameters set is “ULS”. Then we click on “Options” to specify the axial force levels for the interaction diagram.
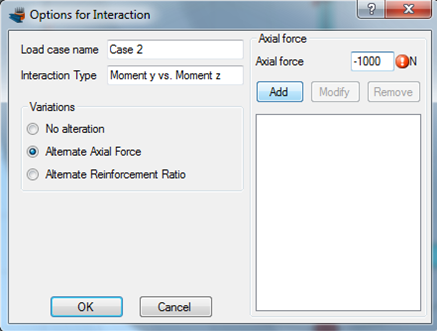
On the form above, we select “Alternate Axial Force” in the “Variations” box on the left. Next, we enter at the top right corner the values -1000 and click on “Add” button. We repeat this step for the value 400.
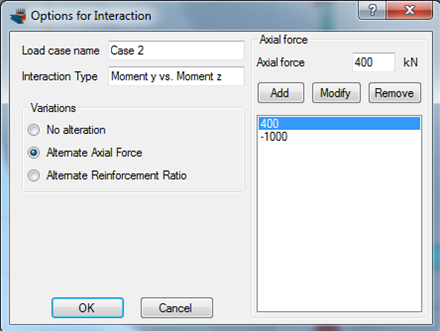
In this way we request the interaction diagram to be produced for both specified axial force levels. We click OK to close the form.
Case 3
As shown before, we click on the button to add the last load case “Case 3”. We make sure that the option “Axial force - Moment about y” is selected and the Analysis Parameters set is “ULS”. Then we click on “Options” to specify the reinforcement ratio values for the interaction diagram.
We select the “Alternate Reinforcement Ratio” option and provide at the top right corner the values of 0.005, 0.015 and 0.025.
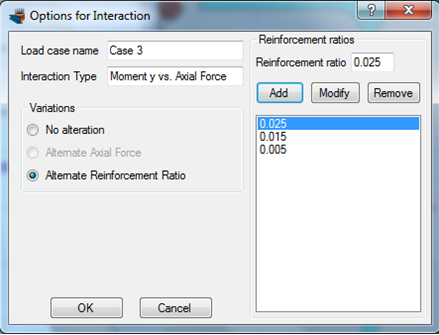
We click ok to close the form.
The 3 load cases are now defined.
Carry out the analysis
We just click Analysis -> Interaction (as per selected R/C code) -> Analyze, to perform the analysis.
Results
The requested interaction diagrams can be obtained by clicking click Analysis -> Interaction (as per selected R/C code) -> Show results.
Interaction diagram for Case 1:
We choose “Case 1” from the list at the top right corner of the form. The interaction diagram for Moment about Y vs. Moment about Z is shown below.
Interaction diagram for Case 2:
By choosing “Case 2”, appears the same interaction diagram, but for different axial force levels.
Interaction diagram for Case 3:
Respectively, by selecting “Case 3”, we can display the interaction diagram in terms of Moment about Y vs. Axial force for three different reinforcement ratio values (0.5%, 1.5% and 2.5%).
Watch the video of this example