A simple method for N‐M interaction diagrams of circular reinforced concrete cross sections
2020-10-09
1 INTRODUCTION
Reinforced concrete (RC) structural members with circular cross section are widely used in structural and geotechnical engineering applications. Typical examples include columns in moment‐resisting frames, foundation piles, and contiguous pile walls. The widespread use of circular cross sections in structural members is mainly due to their simplicity of construction as well as to their identical stiffness and strength features in all horizontal directions. However, while the design of rectangular RC cross sections may be easily performed (even by hand calculations, under some simplifying assumptions), the analysis is more complex in the case of circular cross sections. In absence of analytical solutions, the assessment of axial compression‐bending moment resistance (M‐N) interaction domains is performed numerically.
Research on the topic includes integration methods for both rectangular and circular RC cross sections based on analytical and numerical algorithms (e.g., References 3, 4, 7, 9). For instance, Bonet et al.3 presented a comparative study of different integration methods (both analytical and numerical) of stresses in circular and rectangular RC cross sections subjected to axial loads and biaxial bending. The constitutive equation used for concrete is a parabola‐rectangle from Eurocode 2.5 The comparison is performed in terms of accuracy and computational speed of each investigated method. Similarly, Davalath7 developed a numerical procedure along with a computer code for the analysis of RC circular cross sections subjected to axial loads (compression or tension) and bending moments. Barros et al.2 derived a closed‐form solution for the optimal design of RC cross sections, but only for the rectangular shape. This method is valid for ultimate axial and (uniaxial) bending loading; it relies on the use of a parabola‐rectangle diagram for the concrete in compression. Furthermore, Tumo et al.13 presented an analytical approach for quantifying the contribution of transverse reinforcement to the shear resistance of RC structural members of solid and hollow circular cross section. Recently, Trentadue et al.12 proposed closed‐form approximations of the M‐N interaction domains for RC columns and concrete‐filled steel tubes with circular cross section. A single analytical expression is provided for both cases; however, one parameter (which is function of the mechanical ratio of the reinforcing steel) of the proposed approach has still to be calibrated by means of a numerical optimization procedure.
This note introduces a fully analytical, code‐compatible procedure for the ultimate analysis of RC circular cross sections subjected to axial compression and bending. The study constitutes an improvement over the method proposed in Cosenza et al.6 As in the previous study, the equations are developed by assuming the reinforcement steel area as lumped into an equivalent steel ring completely yielded, whereas the stress‐block diagram is assumed for concrete. In addition, design yield stress of steel is properly modified to obtain more accurate results. Moreover, an analytical approximation is introduced to derive an analytical solution for the computation of M‐N domains without iterations and/or numerical computation.
The rest of this paper is organized as follows. A review of code‐based assumptions and procedures for the assessment of the ultimate flexural capacity of RC cross section is presented first. The proposed analytical method is then described, introducing a simplified approach for the derivation of M‐N domains. This is followed by a validation exercise for the proposed method through a series of illustrative examples.
2 CODE‐BASED ASSESSMENT OF ULTIMATE FLEXURAL CAPACITY FOR RC CROSS SECTIONS
Eurocode 2 (or EC25; Sec. 6.1) provides principles and rules for the assessment of the ultimate flexural capacity of RC members, with or without axial force. To this end, the following simplifying assumptions are made:
Plane cross sections remain plane upon deformation, up to failure;
Strain in bonded reinforcement (whether in tension or in compression), is identical to that in the surrounding concrete (i.e., perfect bonding exists between steel and concrete);
The tensile strength of the concrete is neglected;
Compressive stresses in concrete are derived according to pertinent idealized design stress/strain relationships (EC2, Sec. 3.1.7);
Stresses in reinforcing bars are derived from corresponding design curves (EC2, Sec. 3.2.7);
Design strengths for concrete and steel are defined as f cd = α cc f ck /γ c, f yd = f yk /γ s, respectively (EC2, Secs. 3.1.6, 3.2.7), where α cc is a coefficient taking into account of long term effects on compressive strength and of unfavorable effect resulting from the way the load is applied,1 f ck is the specified (i.e., characteristic, 5%) compressive strength of concrete (cylinder strength) and f yk is the specified yield stress of steel, γ c and γ s are material safety factor according to Eurocode‐like Load and Resistance Factor Design (LFRD);
Material safety factors are γ c = 1.5 for concrete and γ s = 1.15 for steel (EC2, Sec. 2.4.2.4).
It is worth noting that all the above assumptions also hold in the case of ACI 318–14.1 The main difference is that the Eurocode‐based approach to LFRD consists of reducing the material strength values using their conservative percentiles (i.e., characteristic values divided by material safety factors) as design values rather than applying safety factors directly to the sectional strength (as in the ACI 318–14 – see Iervolino and Galasso11 for an extensive discussion on the topic). On the other hand, the specified compressive strength of concrete and the specified yield strength for non‐prestressed reinforcement in ACI 318–14 are directly used to compute the nominal flexural strength of a cross section and this is further reduced by a strength reduction factor in ACI 318–14 (Chapter 21), ranging from 0.65 to 0.9 for moment, axial force, or combined moment and axial force.
According to points 4 and 5, a rigorous assessment of the ultimate flexural capacity may be performed assuming a parabolic‐rectangular relationship between the stress and corresponding strain in the concrete in compression, whereas the steel may be idealized as an elastoplastic‐material (Figure 1a). Such an analysis requires the use of integration procedures and is thereby performed via computer codes such as the Biaxial software,8 among others. As a simpler alternative for the analysis and design of circular cross sections at the Ultimate Limit State (ULS), simplified stress–strain relationships may be utilized. For instance, similarly to ACI 318–14, the stress distribution in the concrete may be assumed as a rectangular stress block extended up to a depth, y, smaller than of the actual neutral axis depth, x, and a magnitude, f’ cd, equal to some fraction of the concrete compressive design strength (generally, y = 0.8x and f’ cd = f cd are assumed). This procedure means, in terms of constitutive models of the materials, that concrete behaves as a perfectly plastic material after reaching a specific threshold value of compressive strain; whereas, below such a strain value, it offers no resistance (Figure 1b). In the framework of simplified methods, an elastic–plastic stress–strain diagram for reinforcing steel, with a horizontal top branch without a strain limit, is recommended. This latter assumption is well justified by experimental results (e.g., see Reference 10). Based on this assumption, the failure of the section always occurs due to concrete crushing, that is, when the maximum concrete strain is equal to an ultimate strain value ε cu (maximum concrete compressive strain) or to a second value ε c2 when the section is all under compression. These deformation characteristics for concrete depend on material strength; see for example Table 3.1 in EC2.
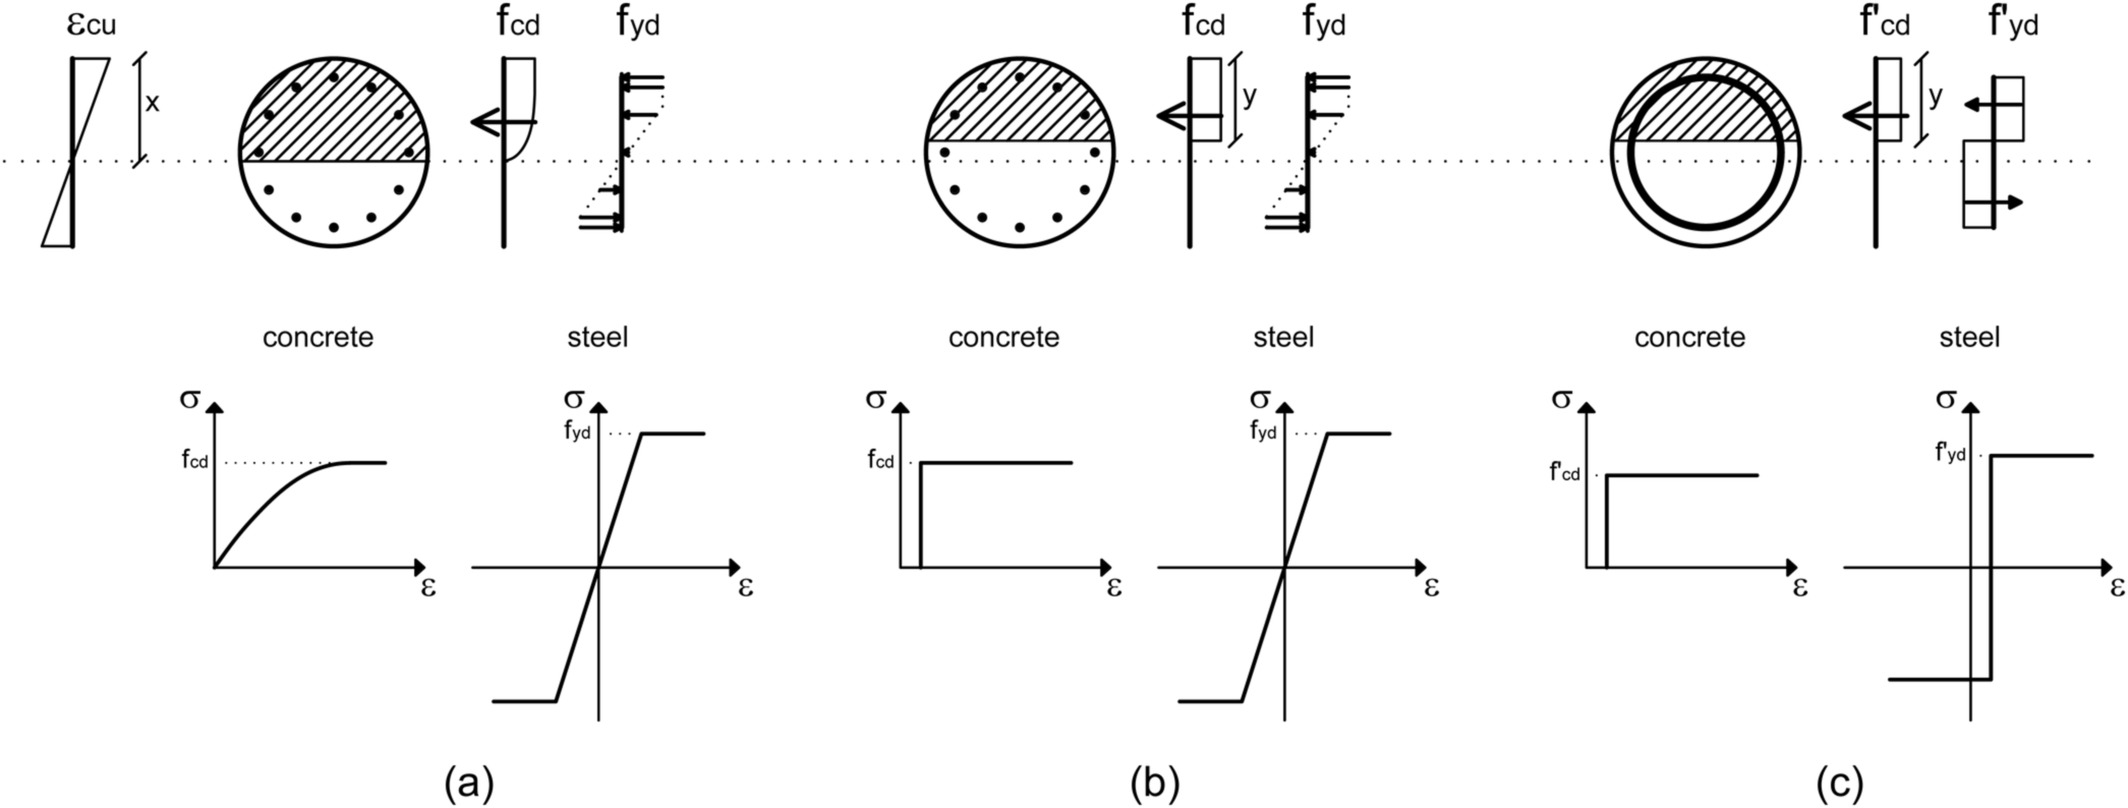
Figure 1
Assumptions on the constitutive behavior of materials and mobilized strength in the different analysis methods: (a) EC2‐based approach with parabola‐rectangle diagram for concrete under compression and bilinear stress‐strain relation for steel; (b) EC2‐based approach with rectangular stress distribution for concrete under compression and bilinear stress‐strain relation for steel; (c) proposed approach
Owing to these simplified assumptions, the computation of the flexural capacity is quite straightforward by solving the equilibrium equations; yet, some iterations are necessary to calculate the position of the neutral axis. A step‐by‐step presentation of the procedure is provided in Cosenza et al.6
3 PROPOSED METHOD
A rigorous analysis of circular cross sections should be performed considering the actual location of the reinforcement longitudinal bars. Such a condition does not allow for a simple analytical expression for the ultimate bending moment capacity. An approximate formulation is possible by means of some straightforward idealizations; specifically (Figure 1c):
The actual longitudinal rebar arrangement is replaced by a thin steel ring with equivalent total area A s;
The actual distribution of concrete stress is replaced by a rectangular diagram with an “effective strength” f’ cd = 0.9 f cd. This assumption concerns a specific EC2 provision for circular cross section: if the width of the compression zone decreases in the direction of the extreme compression fiber the value of the effective strength should be reduced by 10%.
The steel is considered to be at a yielding state, both in compression and tension, contributing an “effective stress” f’ yd = 0.95 f yd. The factor 0.95 has been calibrated by the authors to minimize the discrepancies between the results from the proposed approach and those obtained through more rigorous approaches, as discussed later in the paper.
It is worth noting that these assumptions are equivalent to assuming a perfectly plastic behavior for both steel and concrete, where the threshold strain value (a) separating compression and tension for steel and (b) below which concrete offers no strength has a given, positive value. Hence, for the assessment of the ultimate flexural capacity, regardless of the actual strain profile, materials may be assumed to behave as rigid‐plastic, and the resulting (fictitious) neutral axis depth will coincide with the extension of the compressive zone.
Owing to these hypotheses, the condition of equilibrium between all the internal and external forces applied to the cross section may be written as:
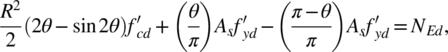 (1)
(1)
where N Ed is the applied axial force and θ is the angle defining the extension of compression zone (Figure 2), ideally varying from 0 (no compression) to π (the section is entirely compressed). In Equation (1), (θ/π) Α s and (1−θ/π) A s are the cross sectional areas of longitudinal reinforcement in compression and tension, respectively.
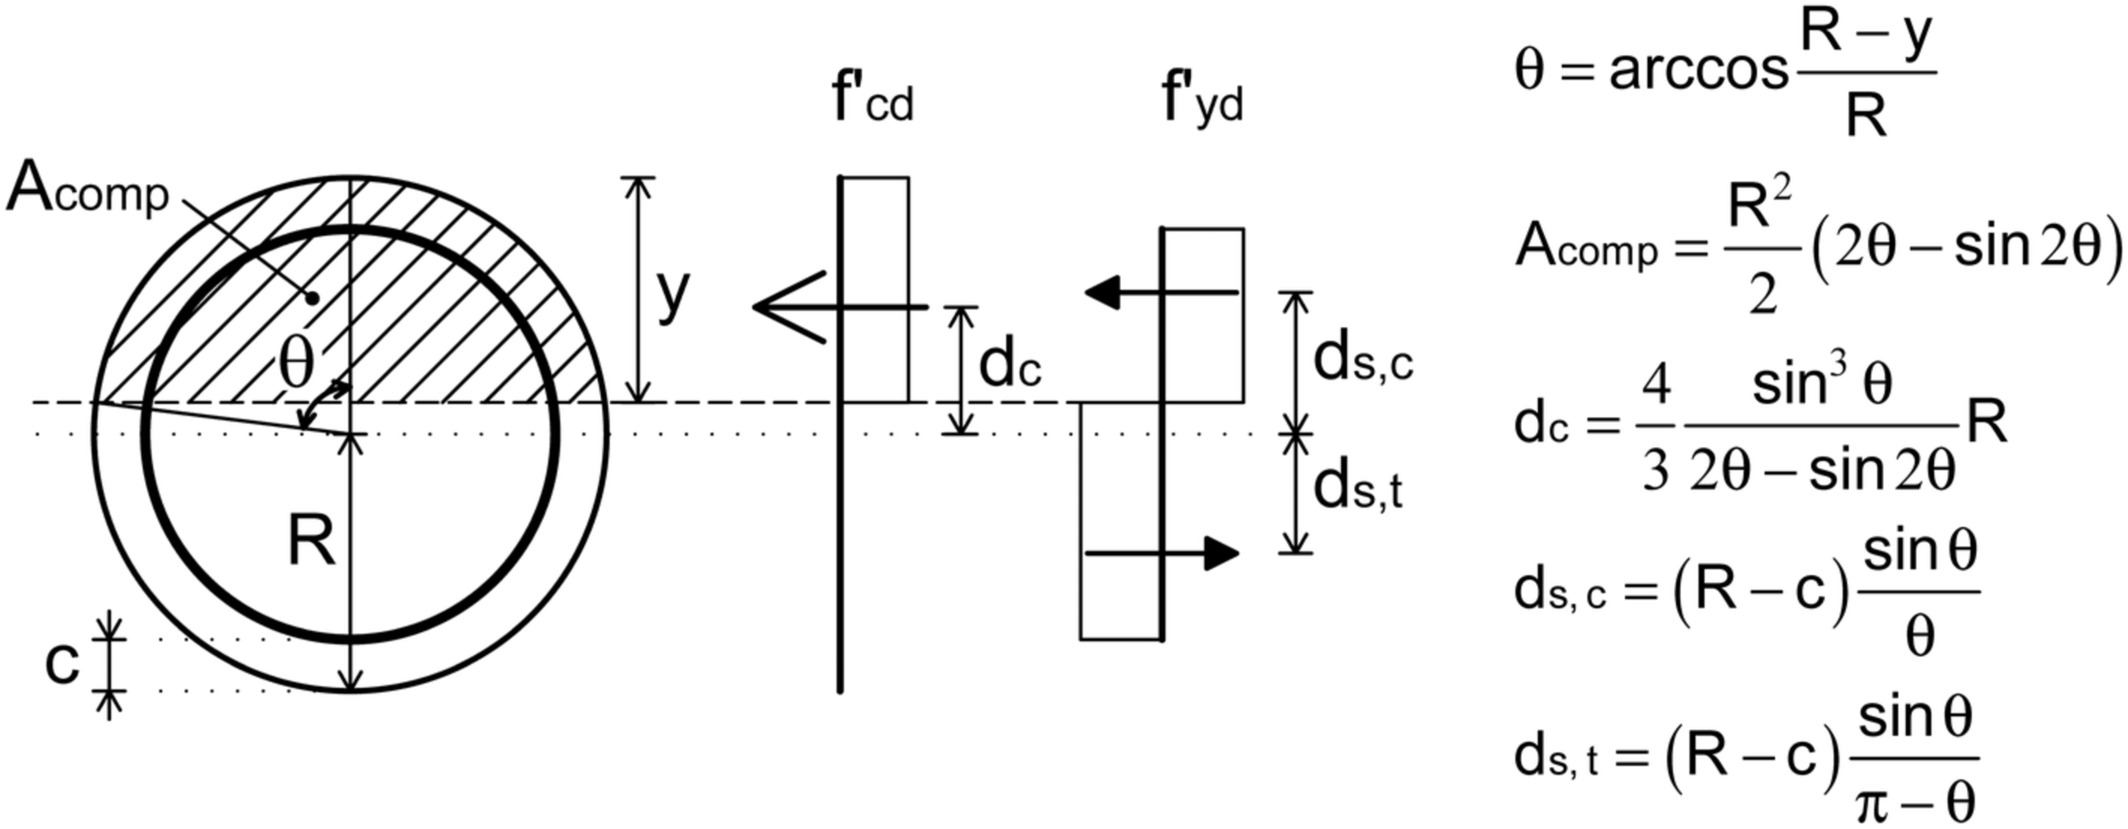
Figure 2
Stress distribution and formulae for the proposed method
Multiplying each term in Equation (1) by  Equation (1) may be reformulated as:
 (2)
(2)
where  and
and 
are the mechanical steel ratio and the design axial force normalized to the total cross sectional concrete area of the member respectively (the prime symbol “′” indicates that quantities are normalized by effective values of design strength – see point 2 and 3 above).
Owing to the transcendental nature of Equation (2), the exact value of the angle θ may be found only iteratively (e.g., using the Newton's method). Nevertheless, an approximate explicit solution for θ is possible by substituting the term sin2θ in Equation (2) with the parabola 16 θ (π/2−θ)/π 2 (for θ ≤ π/2). Consequently, Equation (2) reduces to the second‐order algebraic equation:
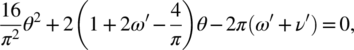 (3)
(3)
which admits the positive solution:
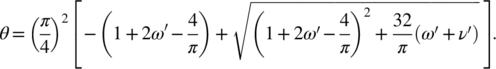 (4)
(4)
A comparison between the exact values of θ obtained from Equation (2) (exact relationship among θ, ν′, and ω′ may be found by fixing the values of θ and ν′, and calculating ω′, or fixing θ and ω′ and calculating ν′) and the correspondent estimates by means of Equation (4) is offered in Figure 3, as a function of dimensionless axial force ν′ and reinforcement ratio ω′. Clearly, approximate estimates and exact values are almost coincident. Note that the simplified expression for θ is valid for ν′ ≤ 0.5, that is, θ < π/2. Nevertheless, as the function θ (ν′) presents a symmetry point around (0.5, π/2), for ν′ > 0.5 the value of θ may be easily derived by symmetry considerations.
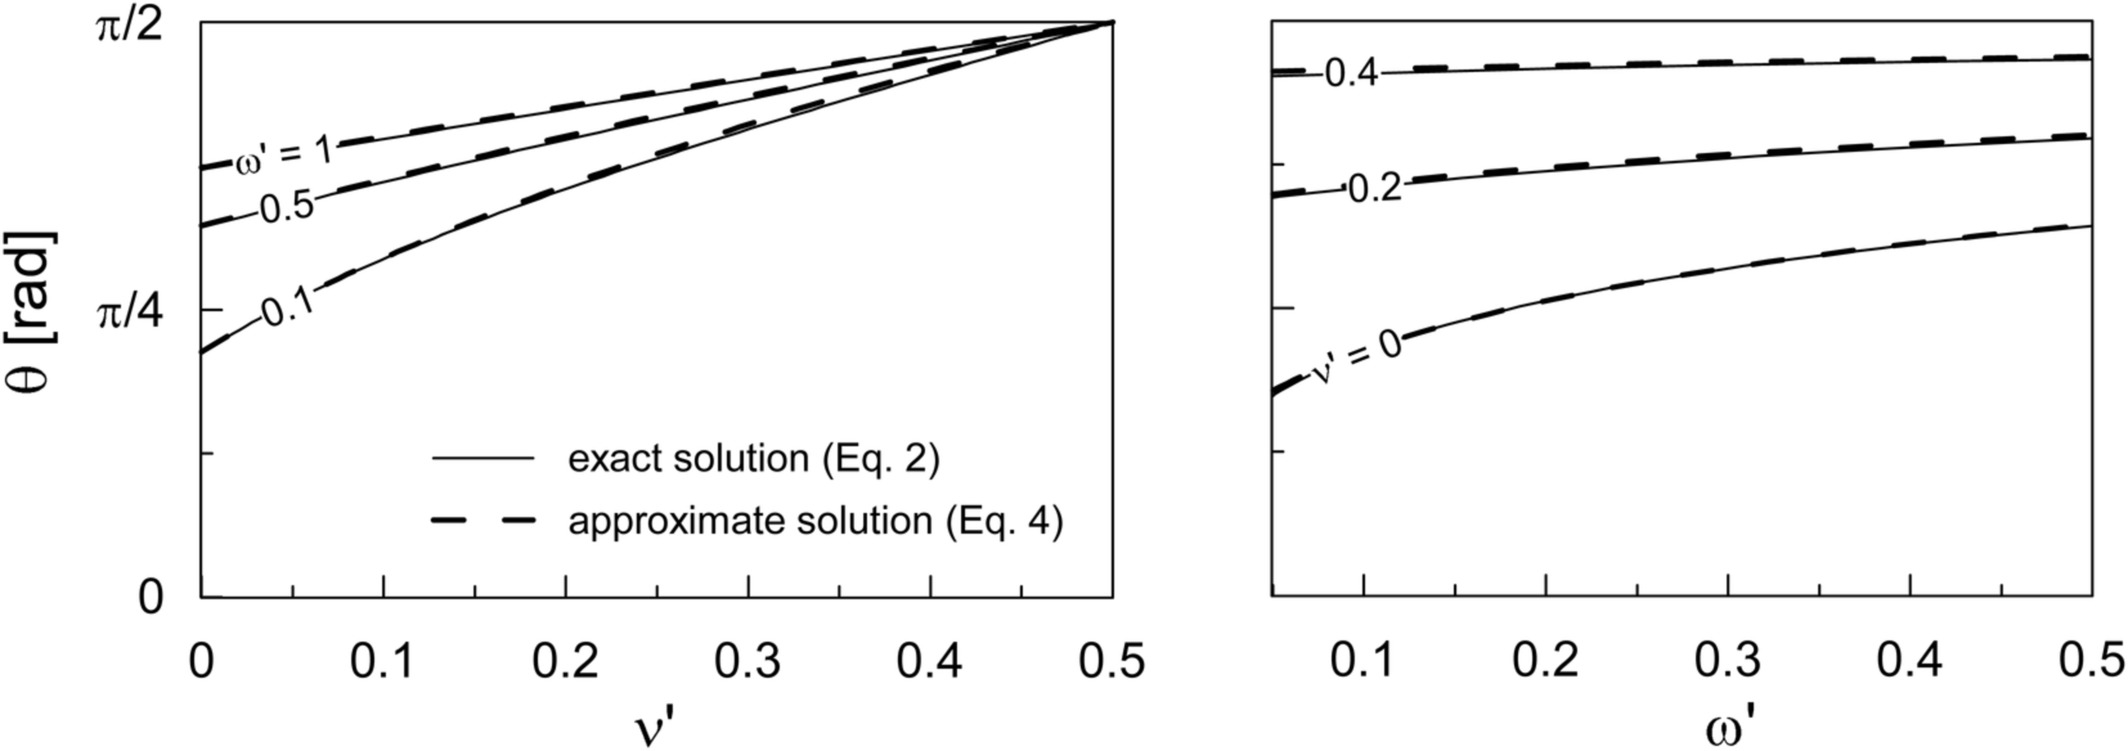
Figure 3
Comparison between exact and approximate values of θ, as function of dimensionless axial force ν′ (left) and mechanical reinforcement ratio ω′ (right)
Once evaluated θ, the design flexural capacity M Rd is equal to the sum of the design flexural resistance due to concrete, M Rd,c, and the design flexural resistance due to steel, M Rd,s. By employing the quantities in Figure 2, it is straightforward to show that:
 (5)
(5)
where c is the concrete cover of cross section; multiplying each term by  Equation (5) may be rewritten as:
 (6)
(6)
where  is the dimensionless bending capacity of the cross section. In this way, the ultimate flexural capacity is expressed in a general form as a function of the relevant dimensionless parameters ω′, ν′, and c/R.
4 M‐N INTERACTION DOMAINS
The proposed method also allows for a simple computation of the interaction domains in an analytical way, by simply varying the axial force and, thereby, retrieving the value of the corresponding ultimate moment capacity by means of Equation (5) or (6). In addition, the simplified assumptions adopted here offer insight in the section layout at failure for some peculiar situations corresponding to specific points on the domain. A sketch of a typical M‐N (or, in dimensionless form, μ′ − ν′) domain is reported in Figure 4. Five (5) key points can be identified.
Point A. This corresponds to the extreme traction load the section can carry. In this situation, no bending is allowed and the whole tensile force is carried by the steel, due to the inherent assumption of no tensile strength offered by the concrete. The axial load is thereby equal to the area of the steel A s multiplied by its design strength  . In dimensionless terms, it is immediate to derive that ν ′ = −ω ′.
Point B. This is the point symmetric to point A and corresponds to pure compression. Both concrete and steel mobilize their strength in any point of the section. The corresponding axial force is given by the sum of the steel capacity  and the concrete capacity
  . In dimensionless terms, ν ′ = 1 + ω′.
Point C. This point is representative of pure bending. In such conditions, total compression force associated to both concrete and steel must equal the tensile steel force. This means that the depth of compression zone y c is less than R. It is straightforward to derive that y c is an increasing function of the amount of reinforcement ω and tends to R when reinforcement increases up to infinity, as in the latter case concrete would give a negligible contribution compared to steel. A simplified expression for the moment capacity under pure bending is presented in Cosenza et al.6
Point E. This point corresponds to a failure condition with the same ultimate moment as in Point C and an associated compressive force. This means that the increase in axial force due to concrete and steel must not produce any bending moment and, therefore, the depth of compression zone is equal to (2R ‐ y c). The same result may be obtained by considering that Point E is the one symmetrical to Point C. The axial force is equal to the ultimate compressive load of an unreinforced section (ν′ = 1). The presence of the steel is, therefore, responsible for the finite moment capacity under normal load.
Point D. This point is associated with the maximum bending capacity of the section, occurring under a dimensionless axial force ν′ = 0.5. It is evident that the stress‐block diagram is extended up to a half cross section, since any increase or decrease of the compression zone would lead to a decrease in the bending moment capacity.
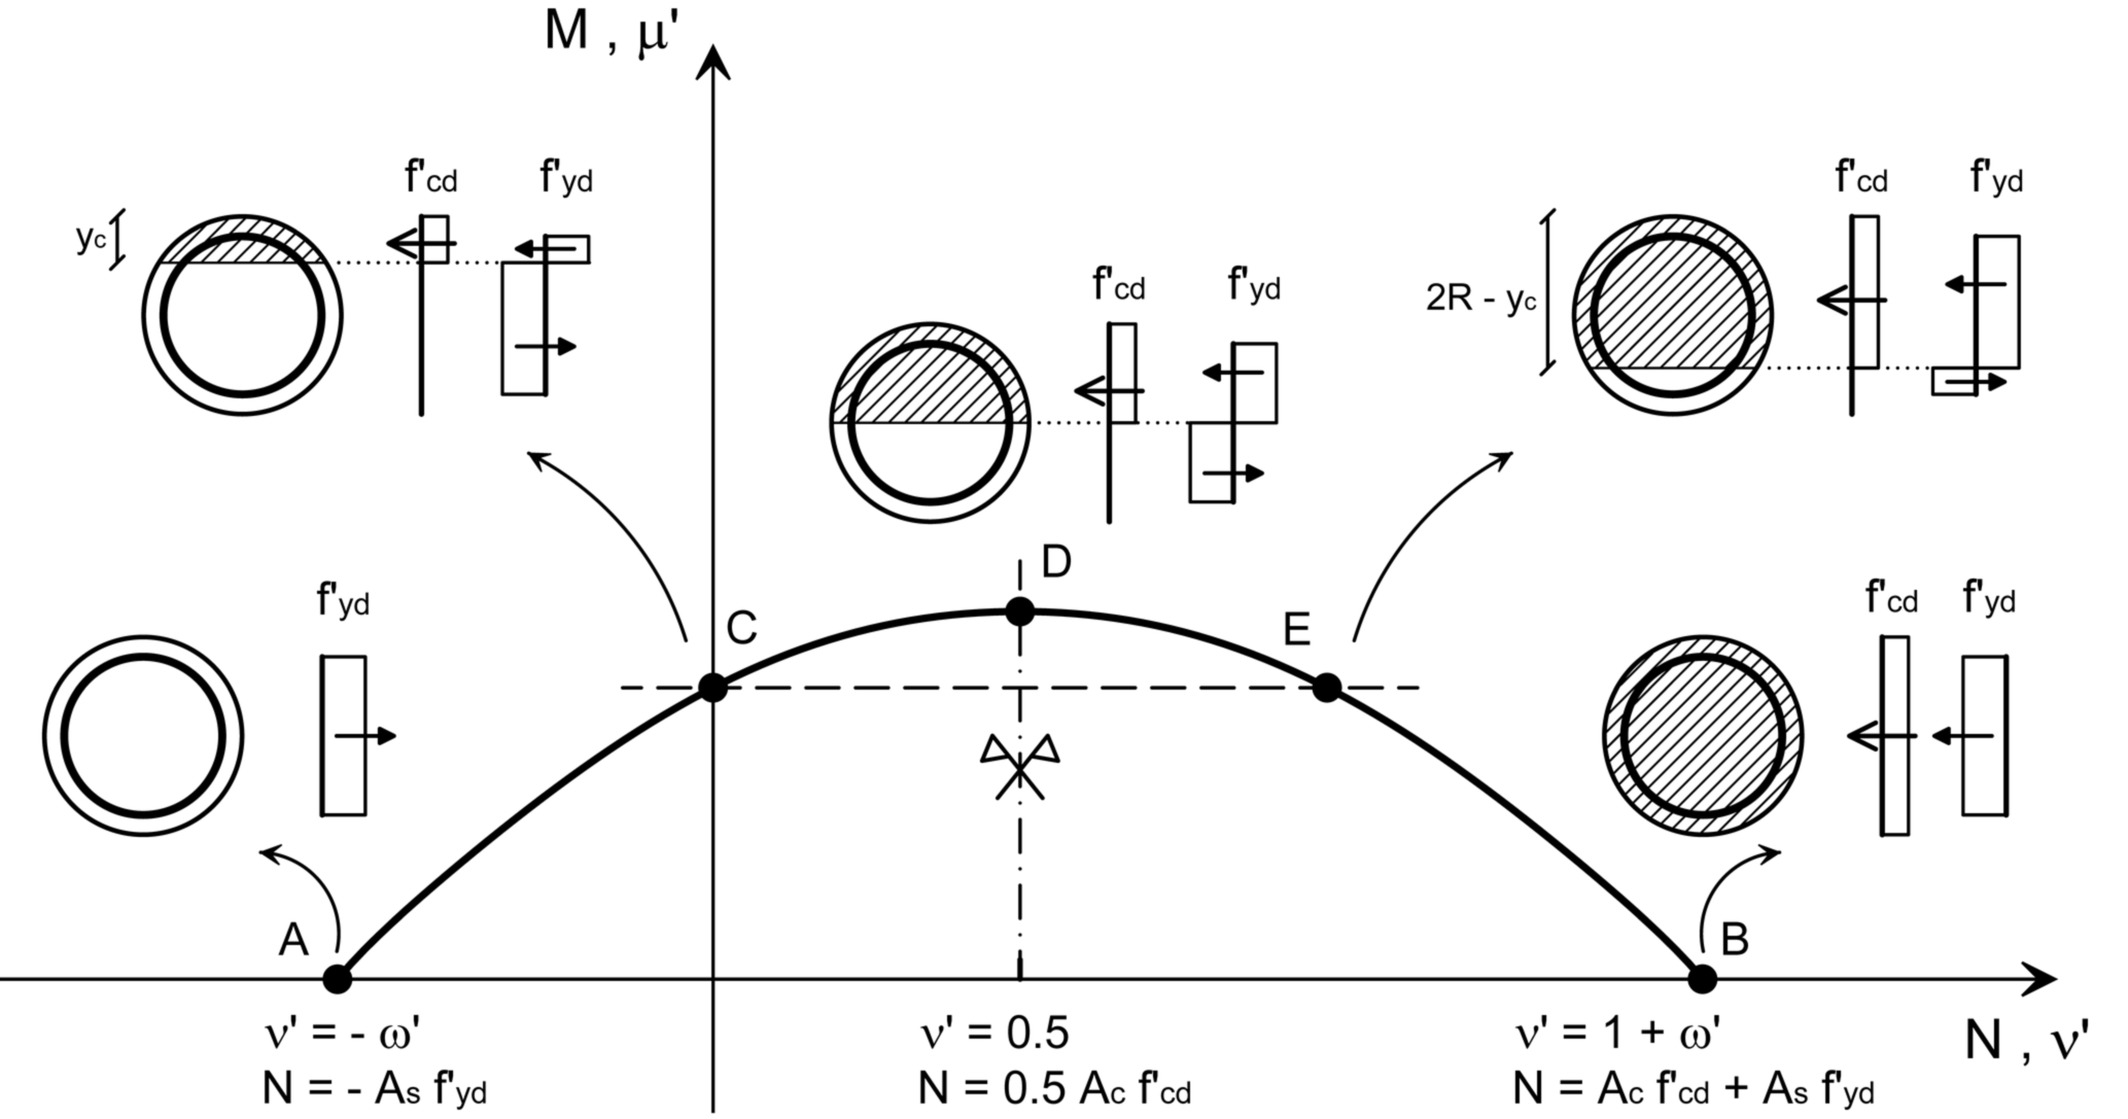
Figure 4
N ‐ M and ν′ ‐ μ′ domain through the proposed method
5 VALIDATION OF THE PROPOSED METHOD
Figure 5 reports a comparison between the results obtained through the proposed approach and a rigorous solution in the realm of the aforementioned assumptions 1–7. EC2 is used as the reference code in this illustrative application; however, similar findings can be obtained by using the ACI 318–14 design framework. Results, expressed through dimensionless pairs ν′: μ′, refer to a circular cross section having a diameter of 50 cm and a concrete cover of 5 cm. Reinforcement is represented by 10, 20, 30, and 40 bars with a diameter ϕ = 16 mm, corresponding to reinforcement ratios ρ approximately equal to 1, 2, 3, and 4% (consistent with detailing rules for local ductility of RC columns in seismic areas). Concrete and steel have design strengths f cd = 14.2 MPa (ε cu = 0.35%) and f yd = 391 MPa, respectively (corresponding to f ck = 25 MPa and f yk = 450 MPa, the latter being the recommended value in Italy). It is noted, by inspecting Figure 5, that the proposed method matches very closely the rigorous results obtained by means of freeware Biaxial (available from the website of the Italian Network of Earthquake Engineering University Labs, or ReLUIS: http://www.reluis.it/index_eng.html). The discrepancies from the rigorous analysis are of the order of 1% for ν′ values relevant to earthquake engineering applications (e.g., ν < 0.55, ν′ < 0.61), whereas the method underestimates by 5–10% the extreme values corresponding to a purely axial force. This is due to the simplifying assumption of reducing design strengths employed in the proposed method. Numerical values, corresponding to ν′ ratios ranging from 0 to 0.5, are also reported in Table 1 together with other formulations. In the table, M rd1 is the most rigorous ultimate flexural capacity of the cross section computed by the Biaxial software; M rd2 represents the same value but computed using the simplified stress‐block diagram for concrete under compression and assuming the effective strength of concrete reduced by 10% according to EC2. (To this aim, an ad hoc MATHWORKS‐MATLAB® script was developed by the authors). Finally, M rd3 is evaluated according to Cosenza et al.6 , whereas M rd4 is the ultimate flexural capacity value of the cross section computed using the proposed method. The mean absolute error of the proposed approach is 1.43%, on the conservative side, offering better performance in predicting the flexural capacity over that provided by both the stress‐block analysis (2.61%) and the Cosenza et al.6 method (3.54%). Note that the error provided by the proposed method is lower than the one by the Trentadue et al.12 approach, which report an average discrepancy of 3.2% versus numerical solutions. Further validation of the proposed approach could also be performed by using results from experimental tests available in the literature. However, this is outside the scope of this note. In fact, it can be quite challenging to gather reliable (especially in terms of sample size, to allow statistically meaningful comparisons) and open (providing the required input data to implement the proposed numerical solution) datasets of experimental tests for RC members with circular cross sections.
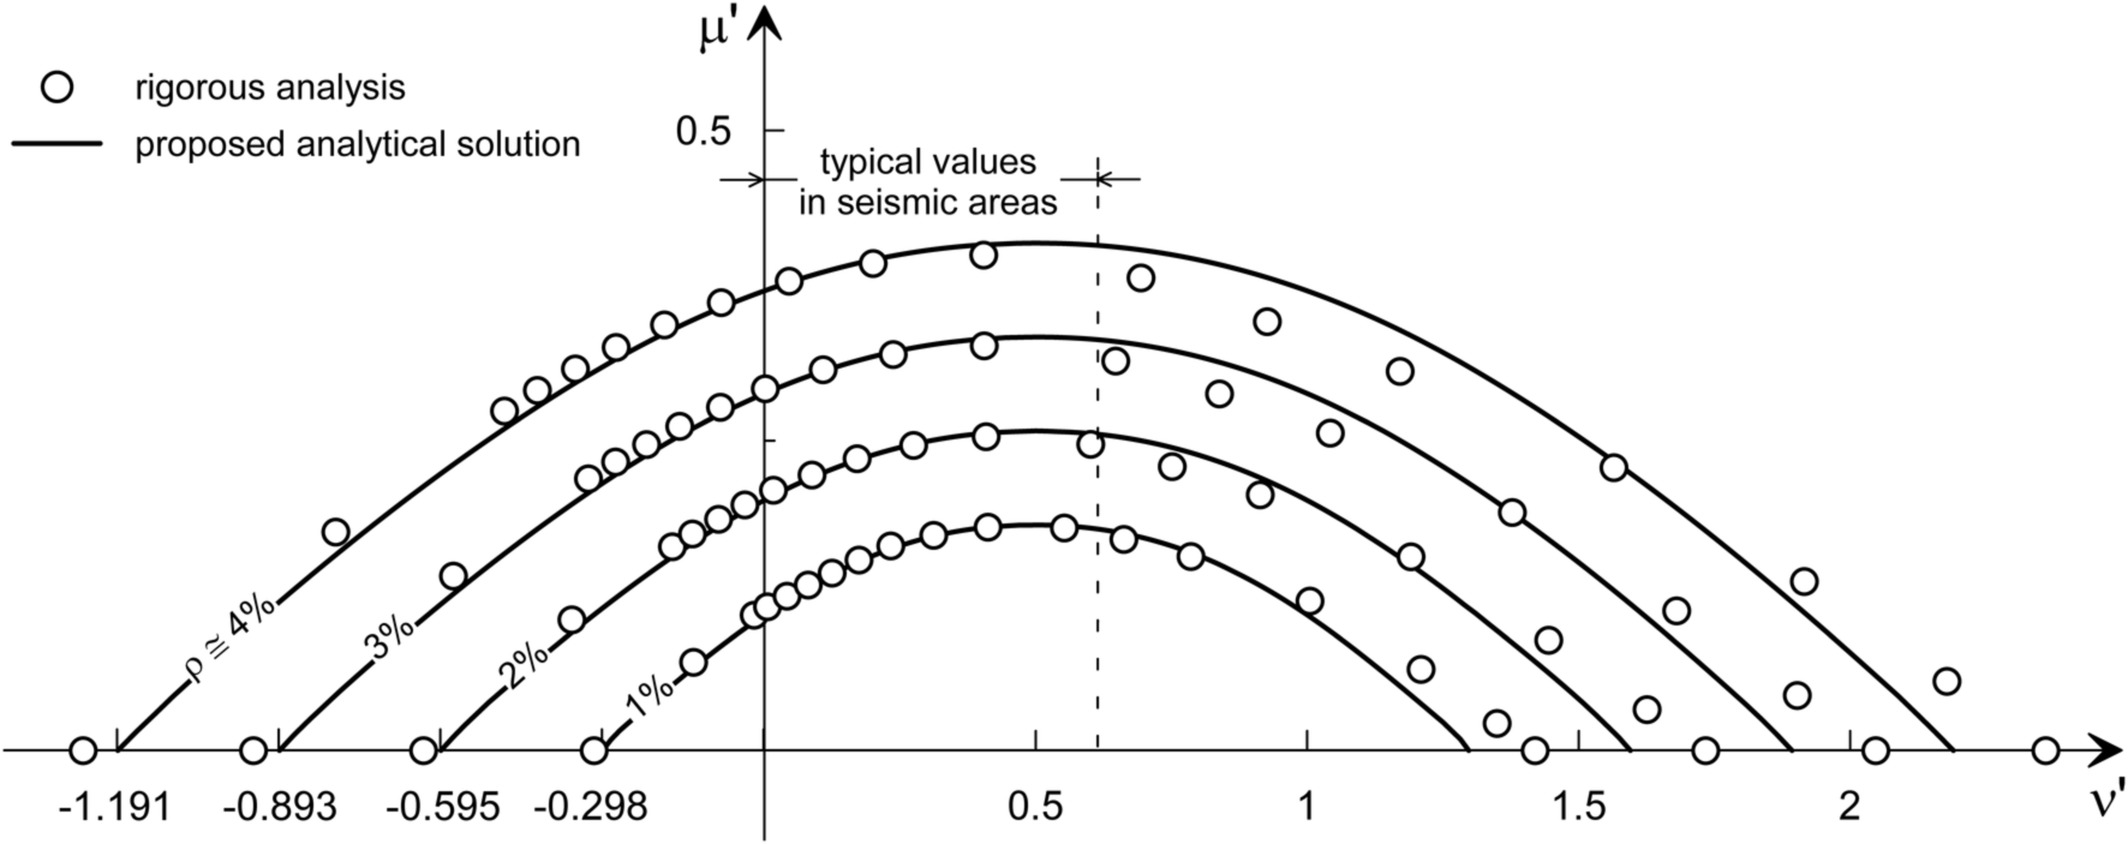
Figure 5
Comparison between results from the proposed method and the rigorous analysis
6 CONCLUSIONS
The choice of a circular cross section for structural members is popular in both geotechnical and structural design, due to simplicity of construction and equal strength under horizontal loading in all directions. In comparison with rectangular cross sections, no analytical solutions are available to evaluate flexural capacity under a specified axial load. This paper aimed at providing a simple, approximate analytical solution in the M‐N space which could facilitate routine calculations. Comparison with rigorous numerical analyses indicates an excellent performance of the proposed approach (maximum discrepancies of less than 5%, typically less than 1%); the proposed approach outperforms existing simplified formulations, the latter being more complicated and involving iterative, or even numerical procedures.
Our software Cross Section Analysis & Design can effectively create automatically the interaction diagrams for arbitrary cross sections of any material, including concrete, steel, comsposite sections etc.
ENDNOTES
- According to EC2, the value of α cc for use in a Country should lie between 0.8 and 1 and the recommended values is 1.
- Note that due to a clerical error, in the original work by Cosenza et al.6 the equation is reported with a wrong coefficient of 4/3 instead of 2/3.
REFERENCES
- 1 American Concrete Institute (ACI) Committee 318, ACI 318–2014: Building code requirements for structural concrete and commentary; 2014.
- 2 Barros MHFM, Barros AFM, Ferreira CA. Closed form solution of optimal design of rectangular reinforced concrete sections. Eng Comput. 2004; 21(7): 761– 776.
- 3 Bonet JL, Barros MHFM, Romero ML. Comparative study of analytical and numerical algorithms for designing reinforced concrete section under biaxial bending. Comput Struct. 2006; 8: 31– 32.
- 4 Brøndum Nielsen T. Ultimate flexure capacity of circular and annular cracked concrete sections. ACI Struct J. 1988; 85(4): 437– 441.
- 5 CEN, European Committee for Standardisation. Eurocode 2: Design of concrete structures. Part 1–1: General rules and rules for buildings; 2004
- 6 Cosenza E, Galasso C, Maddaloni G. A simplified method for flexural capacity assessment of circular RC cross sections. Eng Struct. 2011; 33(3): 942– 946.
- 7 Davalath GSR, Madugula MKS. Analysis/design of reinforced concrete circular cross‐sections. ACI Struct J. 1988; 85(6): 617– 623.
- 8 Di Ludovico M, Lignola GP, Prota A, Cosenza E. Nonlinear analysis of cross‐sections under axial load and biaxial bending. ACI Struct J. 2010; 107(4): 390– 399.
- 9 Elevard NJ. Axial load‐moment interaction for cross‐sections having longitudinal reinforcement arranged in a circle. ACI Struct J. 1997; 94(6): 695– 699.
- 10 Galasso C, Maddaloni G, Cosenza E. Uncertainty analysis of flexural overstrength for new designed RC beams. ASCE J Struct Eng. 2014; 140(7): 04014037.
- 11 Iervolino I, Galasso C. Comparative assessment of load‐resistance factor design for FRP‐reinforced cross sections. Constr Build Mater. 2012; 34: 151– 161.
- 12 Trentadue F, Quaranta G, Marano GC. Closed‐form approximations of interaction diagrams for assessment and design of reinforced concrete columns and concrete‐filled steel tubes with circular cross‐section. Eng Struct. 2016; 127: 594– 601.
- 13 Turmo J, Ramos G, Aparicio AC. Shear truss analogy for concrete members of solid and hollow circular cross‐section. Eng Struct. 2009; 31(2): 455– 465.
Source: doi.org/10.1002/suco.201900139
A novel analytical method is derived for the ultimate capacity interaction diagram (i.e., axial compression, N ‐ bending moment resistance, M) of reinforced concrete (RC) columns with circular cross section. To this aim, the longitudinal rebar arrangement is replaced with a thin steel ring equivalent to the total steel area; moreover, according to modern design approaches, simplified stress–strain relationships for concrete and reinforcing steel are used. Illustrative applications demonstrate that the ultimate capacity computed by the proposed analytical approach agrees well with the results obtained by rigorous methods based on consolidated numerical algorithms. The new solution allows for a rapid, accurate assessment of circular cross section capacity by means of hand calculations; this is especially useful at the conceptual design stage of various structural and geotechnical systems. The method can be easily extended to more general configurations, such as multiple steel rings and composite concrete‐steel sections.