Moment Curvature Diagrams with Cross Section Analysis and Design software
2025-10-07
Understanding Moment Curvature Diagrams for Concrete Cross Sections
Using Engissol Cross Section Analysis & Design Software
1. Introduction
Moment–curvature (M–ϕ) diagrams are essential tools in structural engineering for understanding the nonlinear flexural response of reinforced concrete (RC) cross sections. Unlike simple elastic calculations that assume a constant stiffness, M–ϕ diagrams capture how the section’s stiffness degrades as cracking, yielding, and ultimate failure occur.
The Engissol Cross Section Analysis & Design (CSAD) software is a powerful application that allows engineers to model concrete, steel, FRP, and composite sections and compute their moment–curvature relationships under different loading and material scenarios. This article explains the theoretical background behind M–ϕ analysis and provides a step-by-step guide to generating and interpreting these diagrams in CSAD.
2. Theoretical Background
2.1 Curvature (ϕ)
Curvature represents the bending deformation of a beam or cross section. It is defined as:
ϕ=1/R
where R is the radius of curvature of the deformed member.
For small strains, curvature can also be expressed in terms of strain distribution:
ϕ=(εtop−εbottom)/h
where:
εtop, εbottom = longitudinal strains at extreme fibers
h = total section depth
Curvature essentially describes how “bent” the section is for a given applied moment.
2.2 Moment (M)
The bending moment is the internal force that causes curvature. For a cracked, reinforced concrete section, the internal resisting moment is determined by stress resultants in concrete and reinforcement:
M=∫Aσ(x,y) y dAM
where σ(x,y) is the stress distribution, and y is the distance from the neutral axis.
2.3 Material Nonlinearity in Concrete and Steel
Concrete: Initially behaves elastically in compression but cracks in tension at its tensile strength fctf, after which tensile stress is largely neglected. In compression, it follows a nonlinear stress–strain curve up to fc′.
Reinforcing steel: Usually modeled as elastic–perfectly plastic (or with strain hardening).
The nonlinear interaction of these materials leads to changes in the neutral axis depth and thus to the nonlinear shape of the M–ϕ curve.
2.4 Typical Shape of M–ϕ Curve
A typical moment–curvature diagram for an RC section has three key stages:
Uncracked Elastic Region:
Section behaves elastically; stiffness EIgrossEI_\text{gross}EIgross is constant.
Cracked Elastic–Plastic Region:
Tensile concrete cracks; neutral axis shifts; stiffness decreases.
Yielding & Ultimate Region:
Reinforcement yields, concrete in compression softens, leading to large curvatures at nearly constant or slightly decreasing moment.
This diagram provides insights into stiffness degradation, ductility, and ultimate capacity.
3. Importance of Moment–Curvature Diagrams
M–ϕ diagrams are used for:
Determining flexural stiffness for nonlinear structural analysis.
Assessing ductility of RC sections (ϕ_u / ϕ_y).
Designing members to avoid brittle failure.
Evaluating rotation capacities for plastic hinge design in performance-based seismic engineering.
4. Generating M–ϕ Diagrams in Engissol CSAD
The Engissol Cross Section Analysis & Design software simplifies the complex calculations required to produce M–ϕ diagrams.
4.1 Step-by-Step Procedure
Step 1: Define the Cross Section
Launch CSAD and create a new section project.
Use the built-in geometric tools to define the section shape:
Rectangular, T-beam, circular, or import CAD shapes.
Specify the dimensions accurately (width, height, cover, etc.).
Step 2: Assign Materials
Define concrete grade (e.g., C30/37) with compressive strength fc′f'_cfc′ and stress–strain curve.
Add reinforcement steel type (e.g., B500).
Specify reinforcement layout (bars, spacing, cover).
Step 3: Select Analysis Type
Navigate to Analysis → Moment–Curvature.
Choose loading direction (bending axis) and the axial load level (if applicable).
Set parameters for incremental analysis (number of steps, convergence criteria).
Step 4: Run the Analysis
Click “Analyze” to start the nonlinear incremental solution.
CSAD computes the section’s neutral axis depth, stress–strain profiles, and curvature at each load step.
Step 5: View and Export Results
Access the Moment–Curvature Diagram tab to visualize results.
Examine key points: cracking moment, yielding, ultimate moment.
Export results to Excel or PDF for reporting.
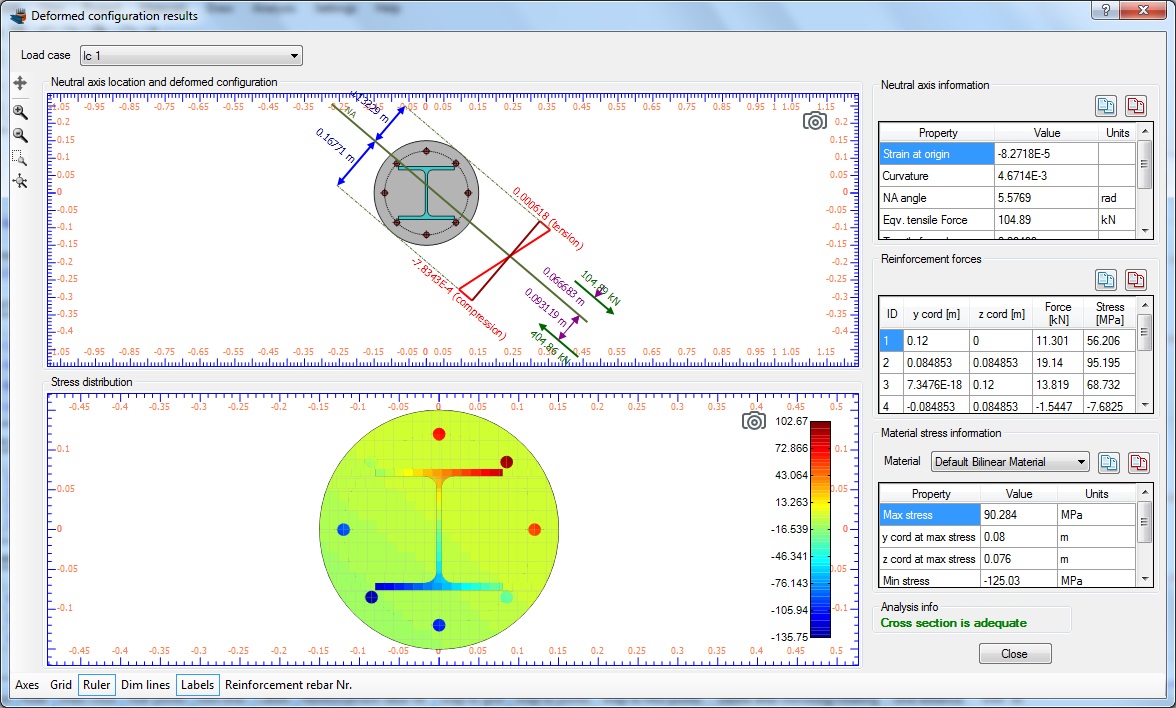
4.2 Interpreting the Output
CSAD displays:
A graph of Moment (kNm) vs. Curvature (1/m).
Tabular data with corresponding strain profiles.
Graphical visualization of cracked section stress blocks.
Key output values include:
M_cr: Cracking moment
M_y, ϕ_y: Yield point
M_u, ϕ_u: Ultimate capacity and curvature
Ductility ratio (ϕ_u / ϕ_y)
5. Practical Tips
Always input realistic material stress–strain curves to capture nonlinear behavior accurately.
Include the effect of axial load, as it shifts the M–ϕ diagram significantly.
Check the neutral axis progression in the software to understand the transition from elastic to inelastic stages.
Use the diagram to evaluate rotation capacity for seismic design.
6. Conclusion
Moment–curvature diagrams bridge the gap between theoretical flexural mechanics and practical structural design. They allow engineers to move beyond simplified elastic analysis to a more realistic, nonlinear assessment of structural performance.
Engissol CSAD streamlines this process by providing a user-friendly interface for defining sections, applying material models, and generating detailed M–ϕ curves. Mastering these diagrams enables engineers to design safer, more ductile, and more efficient reinforced concrete structures.